Introduction
The goal of this blog post is to explain how to use OpenBSM library to perform live audit on macOS to detect which files are open and by whom.
Every day we install a program, or application, on our computer and they can have access to most files.
Real-time auditing can be useful for a lot of reasons: maybe you’re just curious to see which files are opened by some applications or if some malicious processes are reading your personal documents, or maybe opening your photos. Maybe you are not curious but you just want to detect possible ransomware activity to stop them.
The scenarios are infinite.
Another common scenario is that you can use real-time auditing to build and run your personal Host-Based IDS by checking modifications and accesses to sensitive files.
In this blog post I will just explain how this auditing is possible thanks to OpenBSM, giving the reader some other resources for further “investigation” and publishing a small proof-of-concept of a basic implementation.
If you spot a mistake, I’ll be happy to fix it, just send an email to me.
OpenBSM
According to the Trusted BSD project, OpenBSM is an open-source implementation of Sun’s BSM (Basic Security Module) event auditing file format and API originally created for Apple Computer by McAfee Research.
This implementation provides a set of system calls and library interfaces for managing audit records but includes also some command line tools.
As we can see from the configuration files located in /etc/security, by default macOS uses two flags, lo and aa, to log Login/Logout (lo) and Authorization/Authentication (aa) events on the /var/audit/ directory.
$ cat /etc/security/audit_control

#
# $P4: //depot/projects/trustedbsd/openbsm/etc/audit_control#8 $
#
dir:/var/audit
flags:lo,aa
minfree:5
naflags:lo,aa
policy:cnt,argv
filesz:2M
expire-after:10M
superuser-set-sflags-mask:has_authenticated,has_console_access
superuser-clear-sflags-mask:has_authenticated,has_console_access
member-set-sflags-mask:
member-clear-sflags-mask:has_authenticated
We can have some information about these flags, and about all available flags, from another file located on the same directory:
$ cat /etc/security/audit_class

#
# $P4: //depot/projects/trustedbsd/openbsm/etc/audit_class#6 $
#
0x00000000:no:invalid class
0x00000001:fr:file read
0x00000002:fw:file write
0x00000004:fa:file attribute access
0x00000008:fm:file attribute modify
0x00000010:fc:file create
0x00000020:fd:file delete
0x00000040:cl:file close
0x00000080:pc:process
0x00000100:nt:network
0x00000200:ip:ipc
0x00000400:na:non attributable
0x00000800:ad:administrative
0x00001000:lo:login_logout
0x00002000:aa:authentication and authorization
0x00004000:ap:application
0x20000000:io:ioctl
0x40000000:ex:exec
0x80000000:ot:miscellaneous
0xffffffff:all:all flags set
Since we want to monitor which files are accessed by a process, we can build our own audit program using the functions provided from OpenBSM and log, or display, only relevant information. To audit only some information we can then specify one or more of the flags above and, for example, if we want to log which files are open to be read, we can use the flag “fr” identified by the value 0x00000001.
The Basic Security Module Library provides some functions to read these events and automatically parse them. In details, we have 4 functions to manipulate and interact with events:
au_read_rec()
int au_read_rec(FILE *fp, u_char **buf);This function lets us read an event record from a file descriptor and put the content in the buffer buf passed as parameter (which must be freed after use). The function returns the number of bytes read.
au_fetch_tok()
int au_fetch_tok(tokenstr_t *tok, u_char *buf, int len);The buffer obtained from au_read_rec contains tokens, each token is a struct with different information, according to the token id. The first token of the buffer is always a AUT_HEADER* token: it contains a field that indicates which kind of event is on the buffer. The next tokens contain information about the path of the process that raised the event, the path of the file affected by the event and other information like the user, the timestamp… To read the buffer with the record inside we have to fetch every token on it sequentially, using the au_fetch_tok
au_print_tok()
void au_print_tok(FILE *outfp, tokenstr_t *tok, char *del, char raw, char sfrm);Now that we have a token, we can print it to a file descriptor.
au_print_flags_tok()
void au_print_flags_tok(FILE *outfp, tokenstr_t *tok, char *del, int oflags);Another function to print tokens in a more readable way is to use au_print_flags_tok that accepts an additional parameter to specify different output formats (XML, raw, short..).
A typical use of these functions could be:
- Open a file (usually an audit pipe) with fopen() and print records on a buffer from the file by calling au_read_rec().
- Read each token for each record through calls to au_fetch_tok() on the buffer
- Invoke au_print_flags_tok() to print each token to an output stream such as stdout.
- Free the buffer
- Close the opened file
There is only one problem I found while parsing these events with the functions provided: au_print_tok() and au_print_flags_tok() take as input a token from au_fetch_tok() and there is no way to parse or filter it, to have a nicer and more descriptive output of the token.
My solution was to bypass the two functions and manually parse the token to get only the most interesting properties. But how are these tokens structured?
As mentioned before, every event is composed of tokens. A token is just a C struct that contains some information according to the ID of the token.
A read event, for example, has 3 main tokens: AUT_HEADER, AUT_SUBJECT and AUT_PATH.
AUT_HEADER contains information about the event. In a read event, it indicates that the event is a file read (fr).
AUT_SUBJECT defines which process raised this event while AUT_PATH specifies which path was read by the AUT_SUBJECT.
We can manually parse the struct to print only useful information.
The auditpipe
Now that we know how to read events we need to know from where we can take real-time events. The solution is to use a specific device called auditpipe and located in /dev/auditpipe.
The auditpipe is a pseudo-device for live audit event tracking that can be opened as a file and used with the 4 functions above to read and parse our real-time events.
In order to use the auditpipe we need to configure it with ioctl system calls to set up which events we want to get from the pipe.
filewatcher - a simple auditing utility for macOS
I wrote a small utility to monitor file or process activities using the auditpipe and the functions I explained.
You can find it directly on GitHub
To configure the auditpipe I used an example found here.
To parse the token’s structure I used the open source code from OpenBSM.
The code is still pretty messy but it works!
There are not many options at the moment, but my goal is to improve it to have a fully-working auditing tool.
At the moment it is possible to specify which process or which file to monitor.
By default, only some events are displayed, like open/read/write/close. Anyway, it’s possible to display all events thanks to an option. Check the help message!
It’s also possible, for now, to enable debug message logging into a file.
Installation
At the moment, there is only a line of code inside the Makefile to compile the tool, so you can just make and it will compile inside the bin folder.
If you want to manually compile it, you need to include the bsm library:
$ gcc -lbsm filewatcher.c lib/*.c -o bin/filewatcher
Usage
$ sudo ./bin/filewatcher -h
filewatcher - a simple auditing utility for macOS

Usage: ./bin/filewatcher [OPTIONS]
  -f, --file                 Set a file to filter
  -p, --process              Set a process name to filter
  -a, --all                  Display all events (By default only basic events like open/read/write are displayed)
  -d, --debug                Enable debugging messages to be saved into a file
  -h, --help                 Print this help and exit
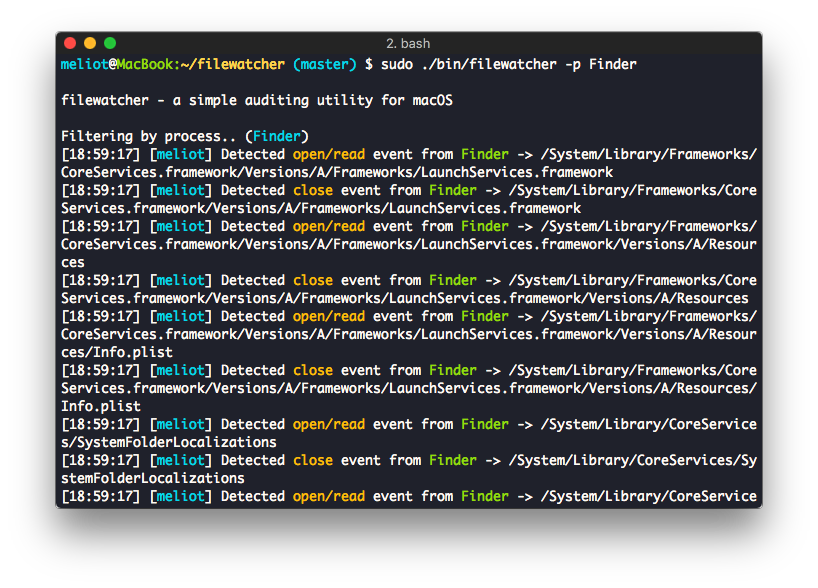 Figure 1 - An example of the output